Nightlights & SDGs
Using imagery from the VIIRS Day Night Bands to visualize changes in economy
New York City, before and after processing
At first glance the black-and-white images of New York City appear to be the same, but when processed, show differences in the quantity of illumination before and during the CoVid pandemic


New York City feb. 15, 2020


New York City apr. 17, 2020
Overview
In order to address the 11.5.2 Sustainable Development Goal indicator, we needed a way to represent a slowing economy with earth data and we found that in an unexpected form: light. As stated by the American Economic Review, nighttime lights provide a reliable indicator of economic productivity through measuring brightness. With this information in mind, our team chose to conduct an observational study investigating the link between nighttime brightness and the timeline of Covid-19.
We explored all forms of data that NASA provided, including Worldview and Earthdata, specifically at the VIIRIS/NPP Daily Night Day Band data. Using an API, we collected imagery obtained from NASA’s VIIRIS database and adapted parts of the REST API powered by ArcGIS to created an program that would identify clusters of of white-pixel density. Through the API, we were able to select two moderately cloudless days depicting the view of the city nightlights. We deliberately chose dates that would be representative of Covid-19’s impact on the economy of cities, and used the same frame and resolution for respective cities. Thus we were able to compare the before and after illumination of five major cities affected the epidemic, which upon further analysis, could be used to directly find a relation between illumination and GDP.
Access the details of the code at https://github.com/hexatedjuice/seersNightLight/blob/master/README.md
Procedure
Heading 1
Our work in numbers
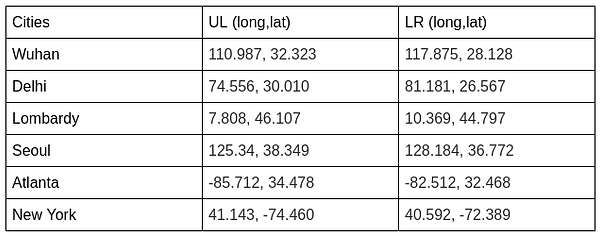
table of areas that represent cities; in coordinates

change in percent illumination from a date of relative normality to a date where Covid-19 peaked in effect